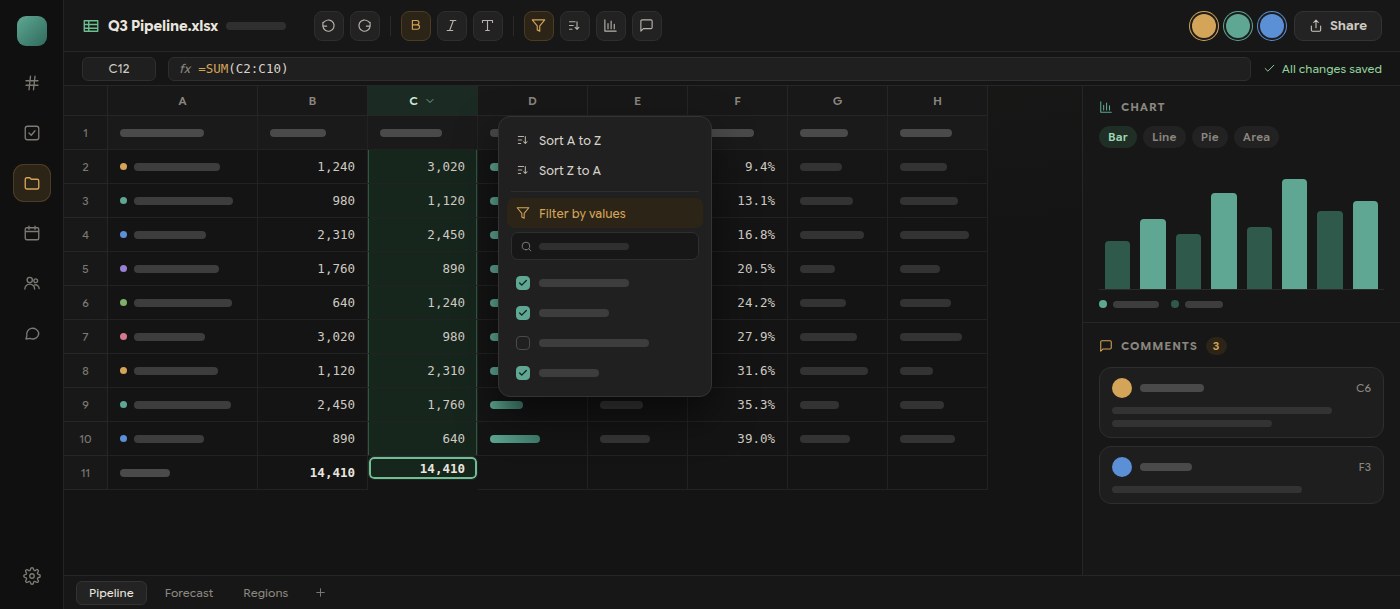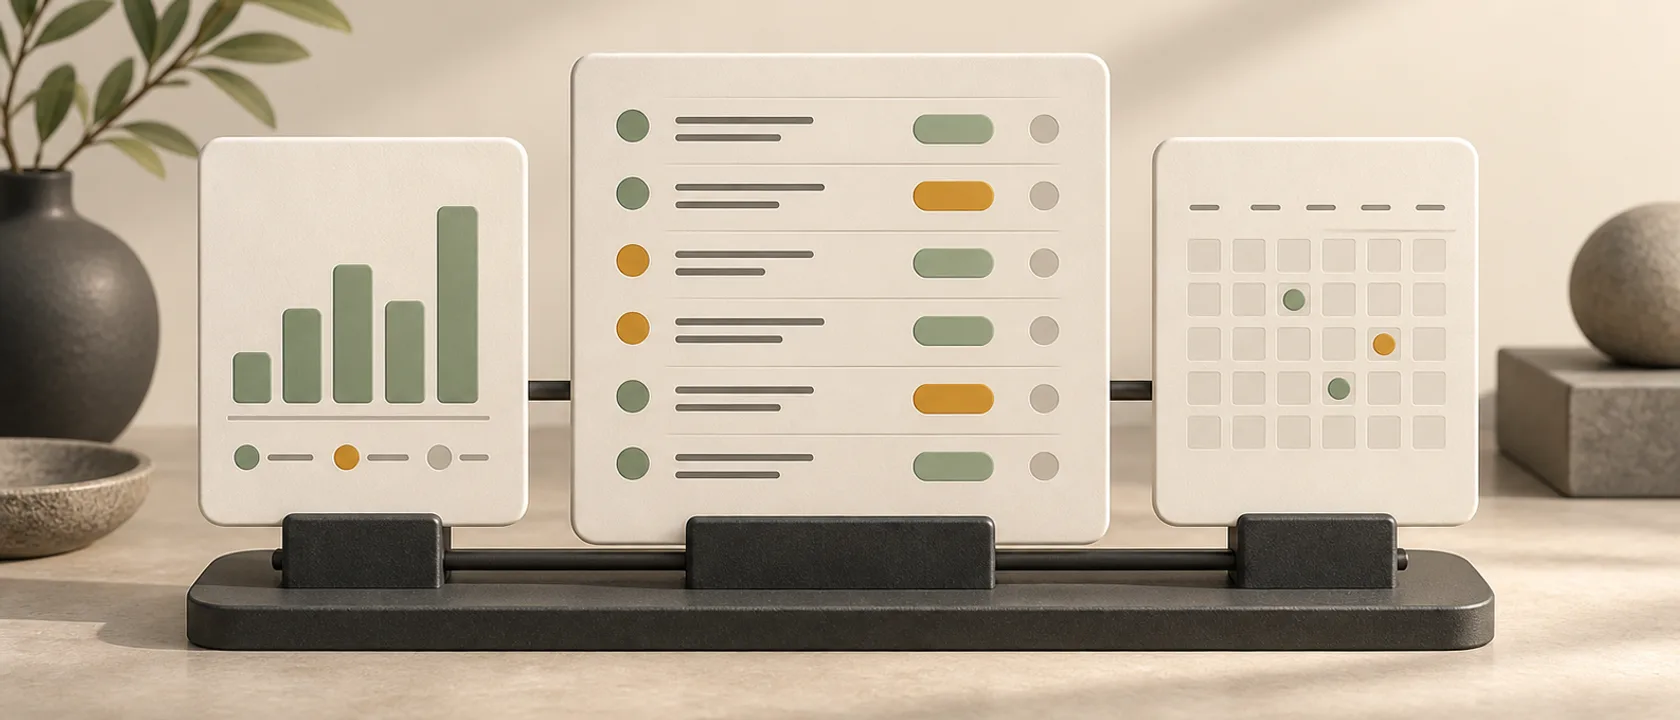
Tables now offers three starting views for a table connected to Tasks: a grid, a chart grouped by status and a calendar organised by due date. Each starts with useful task fields — title, status, assignees, priority and due date — alongside your custom table columns.
Dashboard metric blocks can use the same connected task source as an embedded table view. Choose a task field for an aggregation and apply filters to the tasks you want to measure. This keeps the view and the metric tied to the same work, with loading and error states when source data is unavailable.
Studio also has a channel-grouped overview. Find the apps and tables belonging to each channel, then open the workspace your team needs. The update brings existing Tasks, Tables and Studio closer together, from day-to-day task updates to a shared overview.
- Task grid, status chart and due-date calendar starters
- Core task fields alongside custom table columns
- Dashboard metrics and embedded views using the same task source
- Studio apps and tables grouped by channel